
Affiliate Marketing Metrics: What to Track at Every Stage of Your Program

You launched your affiliate program. Traffic is coming in. But which numbers actually matter?
Most affiliate program owners obsess over vanity metrics like total signups and miss the signals that show whether their program is actually working or slowly bleeding money.
Affiliate marketing metrics are not one-size-fits-all. The numbers you track when starting out are very different from what you watch when scaling. This guide breaks down exactly what to measure at every stage, and how FluentAffiliate makes it easy to see it all in one place.
Key Takeaways: Affiliate Marketing Metrics
- Affiliate marketing metrics are not one-size-fits-all. What you track at launch is very different from what you track at scale.
- A high number of affiliates means nothing if most of them are inactive. Always watch your active affiliate percentage.
- Conversion rate is the heartbeat of your program. For most WordPress-based products, 1% to 5% from affiliate traffic is a healthy range.
- High traffic with low conversions usually means an audience mismatch, not a traffic problem.
- Earnings Per Click (EPC) is the number quality affiliates look at before deciding to promote you. Make it count.
- Cost Per Acquisition (CPA) tells you whether your affiliate channel is actually cheaper than your other marketing efforts.
- FluentAffiliate tracks all your key metrics, visits, referrals, conversions, and payouts, directly inside your WordPress dashboard.
Why Most People Track the Wrong Affiliate Metrics
Before we get into the numbers, let’s talk about why this matters so much.
Imagine you have 500 affiliates in your program. Sounds impressive, right? But if only 20 of them are actively sharing links, and only 5 are actually driving sales, then your “500 affiliates” number is meaningless. It feels good, but tells you nothing useful.
This is the problem with focusing on the wrong metrics. They create a false sense of progress while real issues go unnoticed in the background.
Good affiliate marketing metrics do three things: they tell you what is working, they show you what needs fixing, and they help you make smarter decisions about where to invest your time and money.
The trick is knowing which metrics deserve your attention depending on where your program currently stands.
Stage 1: Metrics for New Affiliate Programs
When your program is fresh, your main job is validation. You want to know: are people even interested? Are affiliates showing up and doing anything? Is traffic coming in?
These metrics answer those questions.
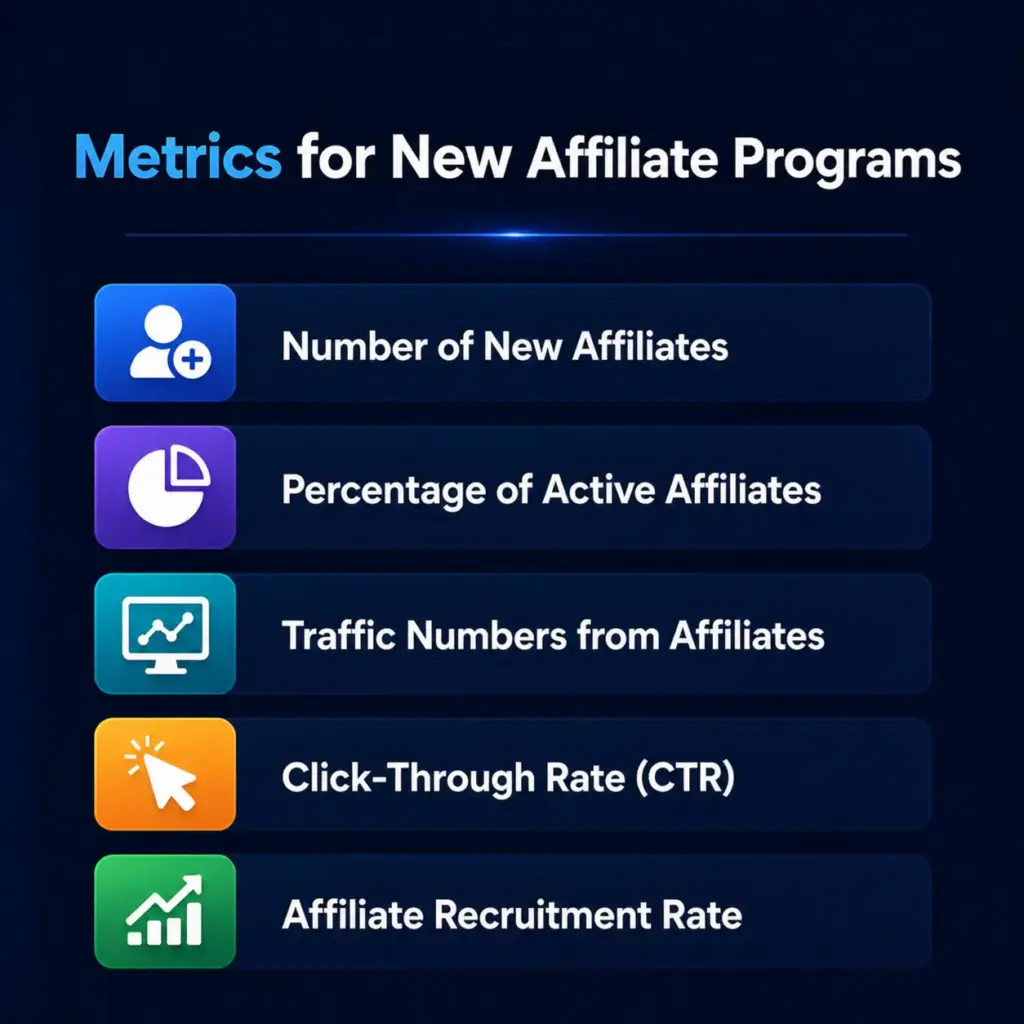
1. Number of New Affiliates Recruited
This one is simple. How many affiliates are signing up within a given period?
- How to track it: Check your affiliate software dashboard. In FluentAffiliate, the admin dashboard shows you active affiliates, pending applications, and new signups at a glance.
- Why it matters: A growing affiliate base means your recruitment efforts are working. A flat line means you need to revisit your outreach, your commission offer, or both.
A healthy benchmark for a new program is steady, consistent growth, not a big spike followed by silence.
2. Percentage of Active Affiliates
Here is where things get honest. Out of everyone who signed up, how many are actually doing something?
- Formula: (Number of active affiliates ÷ Total affiliates) × 100
- Example: You have 200 affiliates signed up, but only 60 are actively sharing links. That is (60 ÷ 200) × 100 = 30% active rate.
- Why it matters: If 200 people signed up but only 15 have ever shared a link, you have an engagement problem, not a recruitment problem.
Most affiliate programs have a surprisingly low active rate. Anything above 30% is solid for a new program. If you are below that, your onboarding process or commission structure might need attention.
FluentAffiliate lets you see affiliate status instantly, filtering between active, pending, and inactive affiliates, so you always know your real engagement picture.
3. Traffic Numbers from Affiliates
How many visitors are arriving at your site through affiliate links?
- How to track it: Use your web analytics combined with your affiliate software’s visit tracking.
- Why it matters: Traffic is the starting point of everything. No traffic means no conversions. But, and this is important, high traffic with nothing else to show for it is a warning sign, not a win.
Always look at traffic alongside other metrics. Traffic alone tells you volume. Traffic combined with conversion data tells you value.
4. Click-Through Rate (CTR)
CTR measures how often people actually click on an affiliate link after seeing it.
- Formula: (Number of clicks ÷ Number of impressions) × 100
- Example: An affiliate’s link was shown 5,000 times and received 150 clicks. That is (150 ÷ 5,000) × 100 = 3% CTR.
- Why it matters: A low CTR tells you that the affiliate’s content or placement is not compelling enough to get people to act. A high CTR with low conversions means the landing experience needs work.
CTR is a great early signal of whether your affiliates are placing links in the right places and writing about your product in a way that makes people curious enough to click.
5. Affiliate Recruitment Rate
Beyond raw numbers, how fast is your affiliate base growing over time?
- How to track it: Compare new affiliate signups month over month.
- Why it matters: A consistently growing recruitment rate signals that word is getting out about your program. A declining rate might mean your program is not visible enough or your offer is not competitive.
Stage 2: Metrics for Growing Affiliate Programs
Once affiliates are active and traffic is flowing, the focus shifts from “are people showing up?” to “are they actually driving results?” These metrics help you fine-tune your funnel and identify your best performers.
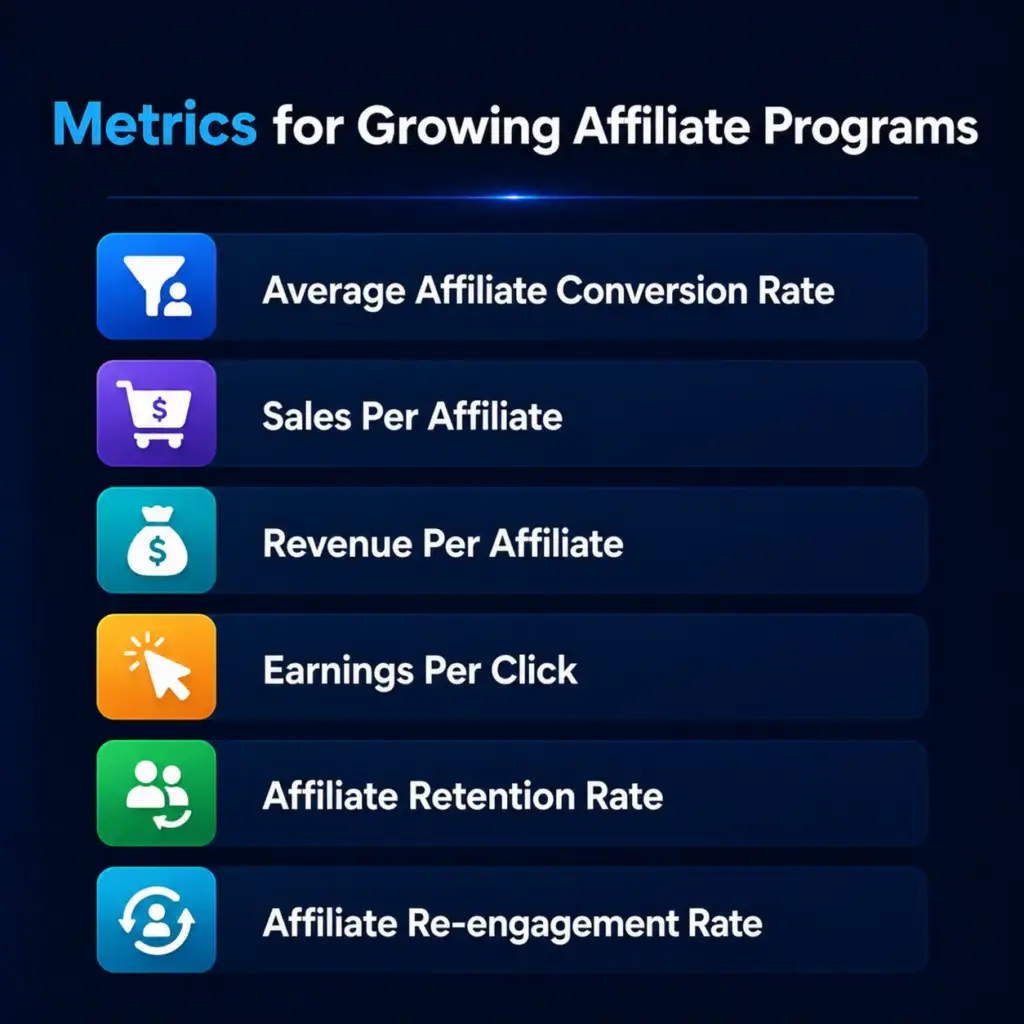
6. Average Affiliate Conversion Rate
This is the percentage of affiliate-referred visitors who take a desired action, whether that is a purchase, signup, or form submission.
- Formula: (Number of conversions ÷ Number of affiliate-referred visitors) × 100
- Example: 1,000 visitors came through affiliate links last month, and 35 made a purchase. That is (35 ÷ 1,000) × 100 = 3.5% conversion rate.
- Why it matters: Conversion rate is the heartbeat of your affiliate program. If traffic is high but conversions are low, something is broken, either the affiliate’s audience is wrong, your landing page is weak, or your offer does not match expectations.
A healthy conversion rate varies by industry, but for most digital products and WordPress plugins, anything between 1% and 5% from affiliate traffic is a reasonable starting range.
FluentAffiliate shows your conversion rate directly on the admin dashboard, giving you a real-time view of how well your affiliate traffic is converting without needing to dig through multiple tools.
7. Sales Per Affiliate
How much revenue is each individual affiliate generating?
- Formula: Total sales generated ÷ Number of active affiliates
- Example: Your program generated $10,000 in sales last month across 20 active affiliates. That is $10,000 ÷ 20 = $500 sales per affiliate.
- Why it matters: This metric separates your star performers from the passengers. It helps you identify who deserves extra attention, better resources, or even a higher commission tier to keep them motivated.
Always look for outliers here. One affiliate generating 80% of your sales is a red flag for dependency. You want a healthy spread across multiple performers.
8. Revenue Per Affiliate (RPA)
Similar to sales per affiliate but focused on the actual revenue generated.
- Formula: Total affiliate revenue ÷ Number of active affiliates
- Example: Your affiliates generated $15,000 in revenue last quarter across 30 active affiliates. That is $15,000 ÷ 30 = $500 revenue per affiliate.
- Why it matters: RPA helps you understand the average value each affiliate brings. If RPA is dropping even as affiliate numbers grow, it means new recruits are underperforming compared to your existing base.
9. Earnings Per Click (EPC)
This one is particularly important for attracting quality affiliates. EPC tells affiliates how much they can expect to earn for every click they send your way.
- Formula: Total affiliate earnings ÷ Total number of clicks
- Example: Your affiliates collectively earned $2,000 from 4,000 clicks last month. That is $2,000 ÷ 4,000 = $0.50 EPC. Every click sent your way earns affiliates 50 cents on average.
- Why it matters: Experienced affiliates compare EPC across programs before deciding where to focus their energy. A strong EPC makes your program more attractive. A weak one will quietly push good affiliates toward competitors.
10. Affiliate Retention Rate
Are the customers your affiliates bring actually sticking around?
- Formula: (Number of returning customers ÷ Total customers from affiliates) × 100
- Example: Affiliates brought in 200 customers last year. Of those, 120 made a second purchase. That is (120 ÷ 200) × 100 = 60% retention rate.
- Why it matters: High retention means affiliates are sending you genuinely interested, high-quality buyers. Low retention suggests a mismatch between what affiliates are promising and what you are actually delivering.
11. Affiliate Re-engagement Rate
Over time, some affiliates go quiet. Re-engagement rate tracks how successfully you are bringing them back.
- How to track it: Monitor the activity levels of previously inactive affiliates after outreach campaigns or incentive offers.
- Why it matters: Re-engaging a dormant affiliate is almost always cheaper than recruiting a brand new one. A good re-engagement strategy can unlock a lot of hidden revenue.
Stage 3: Metrics for Mature Affiliate Programs
When your program is established and running smoothly, the conversation shifts from growth to quality and profitability. These metrics tell you not just how much affiliates are selling, but how valuable those customers are over time.
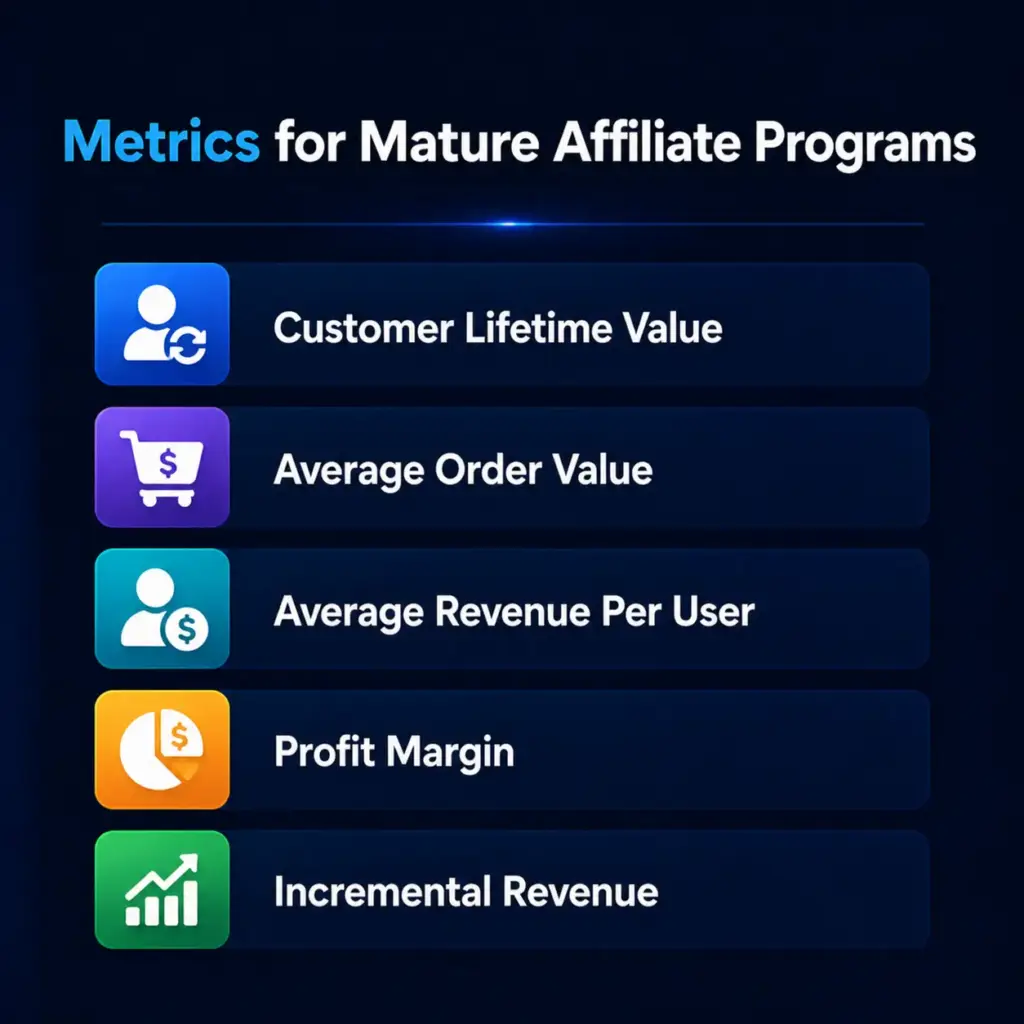
12. Customer Lifetime Value (CLV)
CLV is the total revenue you can expect from a single customer over their entire relationship with your business.
- Formula: (Average purchase value × Purchase frequency) × Average customer lifespan
- Example: Customers referred by affiliates spend $50 on average, buy 3 times a year, and stay for 2 years. That is ($50 × 3) × 2 = $300 CLV per customer.
- Why it matters: If your affiliates are bringing in customers who buy once and disappear, your program might look healthy on the surface but actually be quite fragile underneath. CLV helps you understand the real, long-term value of affiliate-driven customers.
Comparing CLV of affiliate-referred customers versus customers from other channels is a powerful way to measure the true quality of your affiliate program.
13. Average Order Value (AOV)
How much does the average customer spend per order when they come through an affiliate link?
- Formula: Total revenue from affiliates ÷ Number of orders
- Example: Affiliates drove $8,000 in revenue from 100 orders last month. That is $8,000 ÷ 100 = $80 average order value.
- Why it matters: AOV gives you important information for structuring your commission rates. If affiliate-referred customers tend to buy higher-value packages, you might consider rewarding those affiliates more generously.
14. Average Revenue Per User (ARPU)
ARPU measures the revenue generated per user over a specific time period.
- Formula: Total revenue ÷ Number of users
- Example: Your affiliate program generated $12,000 last month from 400 users. That is $12,000 ÷ 400 = $30 ARPU.
- Why it matters: ARPU helps you evaluate how much each affiliate-referred customer is contributing to your bottom line over time, not just at the point of first purchase.
15. Profit Margin
How much are you actually keeping after paying commissions and covering other costs?
- Formula: (Total revenue – Total expenses) ÷ Total revenue × 100
- Example: Your affiliate program brought in $20,000 in revenue, and total costs including commissions and tools were $14,000. That is ($20,000 – $14,000) ÷ $20,000 × 100 = 30% profit margin.
- Why it matters: A program generating a lot of revenue but with razor-thin margins after commissions is not sustainable. Profit margin keeps you honest about whether your affiliate program is genuinely profitable or just busy.
16. Incremental Revenue from Affiliates
This is the revenue your affiliate program generates that would not have existed without it.
- How to track it: Compare revenue during affiliate promotion periods versus baseline periods without affiliate activity.
- Why it matters: Incremental revenue shows the true additive value of your affiliate program. It answers the honest question: would we have made these sales anyway?
Stage 4: Metrics for Cost and ROI
If you are investing in your affiliate program, whether through higher commissions, bonuses, or tools, you need to know exactly what you are getting back.
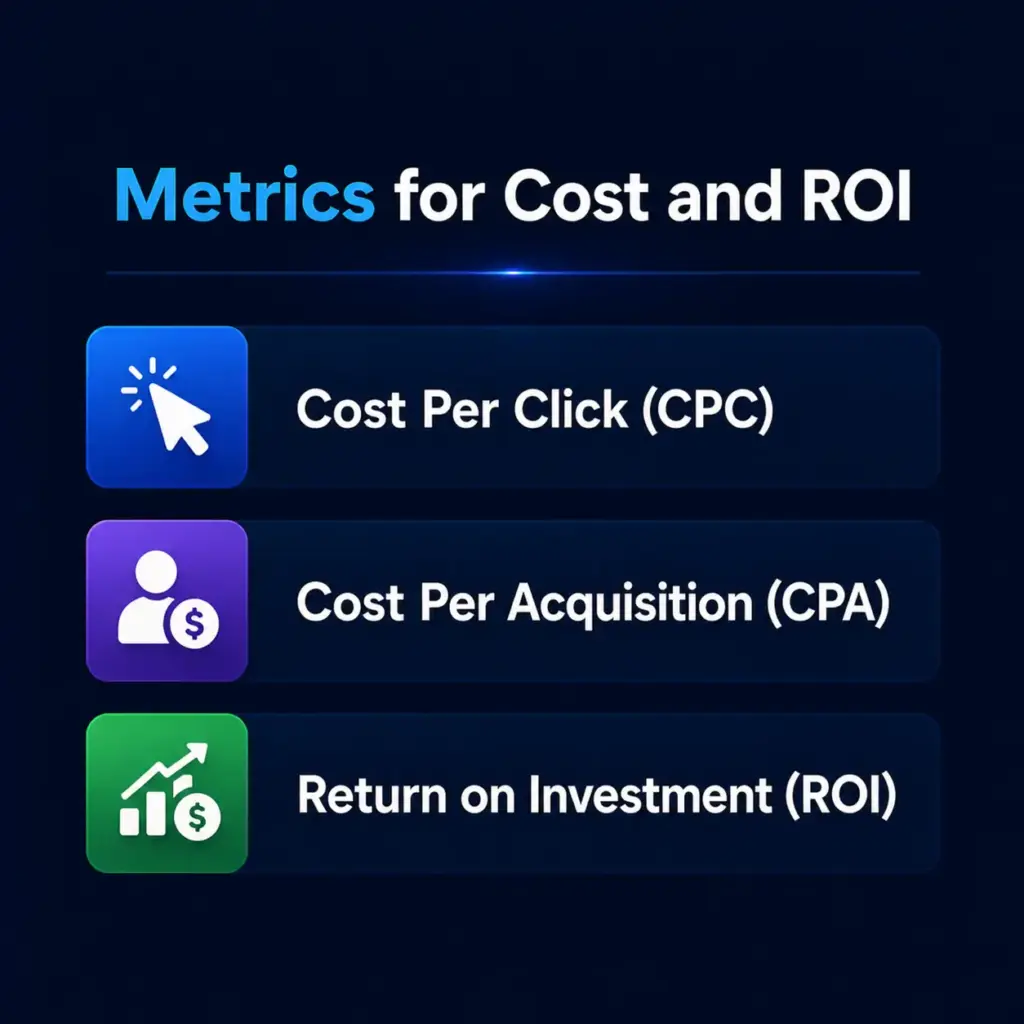
17. Cost Per Click (CPC)
The average cost you incur for each click generated through your affiliate program.
- Formula: Total cost of affiliate program ÷ Total number of clicks
- Example: You spent $500 on commissions and tools last month and got 2,500 clicks from affiliates. That is $500 ÷ 2,500 = $0.20 CPC.
- Why it matters: CPC helps you assess the efficiency of your spend. A rising CPC without a corresponding rise in conversions means you are paying more for less valuable traffic.
18. Cost Per Acquisition (CPA)
How much does it cost you to acquire one customer through your affiliate channel?
- Formula: Total cost of affiliate program ÷ Number of new customers acquired
- Example: You spent $1,000 running your affiliate program last month and acquired 25 new customers. That is $1,000 ÷ 25 = $40 CPA per customer.
- Why it matters: CPA is one of the most important efficiency metrics in any marketing channel. Compare your affiliate CPA against other channels like paid ads or email to see where affiliates genuinely stack up.
A lower CPA means your affiliate program is delivering customers more efficiently. A rising CPA is a signal to review your commission structure or the quality of affiliates you are working with.
19. Return on Investment (ROI)
The ultimate measure of whether your affiliate program is worth it.
- Formula: (Revenue from affiliates – Cost of affiliate program) ÷ Cost of affiliate program × 100
- Example: Your affiliate program generated $5,000 in revenue and cost $1,000 to run. That is ($5,000 – $1,000) ÷ $1,000 × 100 = 400% ROI. For every dollar spent, you got four back.
- Why it matters: ROI cuts through all the noise. A positive ROI means your program is making money. A negative ROI means it is costing you more than it brings in, and something needs to change fast.
Stage 5: Metrics for Churn and Compliance
A growing program is great, but a sustainable program requires watching what is walking out the back door at the same time.
20. Customer Churn Rate
The percentage of affiliate-referred customers who stop buying from you over a given period.
- Formula: (Customers at start of period – Customers at end of period) ÷ Customers at start of period × 100
- Example: You started the month with 300 affiliate-referred customers and ended with 270. That is (300 – 270) ÷ 300 × 100 = 10% churn rate.
- Why it matters: High churn from affiliate traffic often signals a product-fit problem or a mismatch between affiliate audiences and your actual buyer persona. It is a quiet problem that can quietly kill profitability.
21. Rate of Returns or Cancellations
How often are purchases made through affiliate links being returned or cancelled?
- How to track it: Monitor return and cancellation data in your sales platform and cross-reference with affiliate traffic.
- Why it matters: A high return rate from a specific affiliate is a red flag. It could indicate misleading promotions, audience mismatch, or in some cases, fraudulent activity.
22. Affiliate Attrition Rate
How many affiliates are leaving your program over time?
- Formula: (Affiliates at start of period – Affiliates at end of period) ÷ Affiliates at start of period × 100
- Example: You started the quarter with 100 affiliates and ended with 85. That is (100 – 85) ÷ 100 × 100 = 15% attrition rate.
- Why it matters: Some attrition is normal and healthy. But a rapidly rising attrition rate suggests your program is not competitive, your payouts are too slow, or your affiliates do not feel supported.
Regularly checking in with affiliates and making sure your commission structure stays competitive goes a long way toward keeping attrition low.
23. Compliance Rate
Are your affiliates following your program’s terms and conditions?
- How to track it: Regular auditing of affiliate promotional content and link activity.
- Why it matters: Non-compliant affiliates can damage your brand reputation, create legal issues, and attract fraudulent traffic. A strong compliance monitoring process protects the integrity of your entire program.
Stage 6: Metrics for Scaling and Long-Term Growth
Once your program is healthy and profitable, you shift focus toward sustainable growth. These metrics tell you whether you are building something that compounds over time.
24. Year-on-Year Revenue Growth
How much has your affiliate revenue grown compared to the same period last year?
- Formula: (Revenue this year – Revenue last year) ÷ Revenue last year × 100
- Example: Your affiliate program generated $30,000 this year and $20,000 last year. That is ($30,000 – $20,000) ÷ $20,000 × 100 = 50% year-on-year growth.
- Why it matters: Year-on-year growth gives you the clearest picture of whether your program is genuinely scaling or just fluctuating. Strong YoY growth signals that your affiliate strategy is compounding effectively.
25. Affiliate Satisfaction Rate
How happy are your affiliates with your program?
- How to measure it: Regular surveys, direct outreach, and monitoring response rates to program communications.
- Why it matters: Happy affiliates promote more passionately. Frustrated affiliates go quiet or switch to competitors. Satisfaction is a leading indicator of future performance, and it is one of the most undertracked metrics in most affiliate programs.
How to Turn Affiliate Metrics Into Actionable Insights
Tracking numbers is the easy part. Knowing what to do with them is where most programs struggle. Here is a practical framework:

Set clear goals first
Before you measure anything, decide what success looks like. Are you trying to increase traffic, improve conversion rates, or boost long-term customer value? Your goals determine which metrics matter most right now.
Review consistently
Pick a regular cadence, weekly, monthly, or quarterly, and stick to it. Sporadic analysis leads to reactive decisions. Consistent analysis lets you spot trends early before they become problems.
Segment your data
Do not just look at program-wide averages. Break metrics down by individual affiliate, by product, by traffic source, and by promotion type. Averages hide the most interesting insights.
Benchmark against yourself
Industry benchmarks are useful context, but the most valuable comparison is against your own historical data. Are your numbers improving month over month? That is what matters most.
Act on what you find
If a metric is declining, investigate why before assuming you know the answer. If conversion rates drop, it could be a landing page issue, an affiliate audience mismatch, or a seasonal pattern. Dig before you decide.
How FluentAffiliate Helps You Track All of This
Here is where FluentAffiliate genuinely earns its place in your WordPress stack.
Rather than juggling spreadsheets, third-party analytics tools, and manual reports, FluentAffiliate brings your most important affiliate metrics into a single, clean dashboard built right into WordPress.

From the Admin Dashboard, you get an instant overview of total paid commissions, total unpaid earnings, active affiliates, total visits, total referrals, conversion rate, and total order value from affiliate referrals. These are not buried three clicks deep. They are on your screen the moment you open the plugin.
The Visits section gives you a granular, click-by-click log of every visitor who arrived through an affiliate link, including whether that visit converted, where the click came from, and which affiliate link was used. You can even track UTM parameters for advanced campaign-level analysis.
The Referrals section lets you filter by status, paid, unpaid, pending, and rejected, so you always know exactly where your commissions stand. You can see which affiliates are generating the most referrals, the commission amounts, and the associated orders.
The Payouts section keeps your financial picture clean. it tracks every payout, generates detailed reports, and exports CSV files with affiliate names, emails, payout amounts, and currencies, making payment processing as painless as possible.
The Affiliate Profile view takes things even further. Click on any individual affiliate and you get a full breakdown of their all-time stats, including total paid, total unpaid, total order value, conversion rate, total visits, and total referrals, plus a visual activity graph showing their performance over time.
For programs using integrations like WooCommerce, FluentCart, Easy Digital Downloads, MemberPress, TutorLMS, Fluent Forms, or any of FluentAffiliate’s other supported platforms, referral tracking happens automatically. Sales are captured, commissions are calculated, and your metrics stay up to date without any manual work.
If you are running an affiliate program on WordPress and you are still trying to track all of this manually, FluentAffiliate genuinely changes the experience.
Get the Best Affiliate Plugin for WordPress
Conclusion
Track the right metrics at the right stage. Early on, focus on recruitment and traffic. As you grow, watch conversion rates and EPC. At maturity, profitability metrics like CLV and CPA take over.
FluentAffiliate puts all of this inside your WordPress dashboard so you always know exactly where your program stands. Get started with FluentAffiliate today and take control of your affiliate program metrics.


Leave a Reply